Highs, lows & isobars
On a surface chart, isobars join places of equal pressure. Two centres matter (Northern Hemisphere):
| Low (cyclone) | High (anticyclone) | |
|---|---|---|
| Air motion | converges and rises | subsides and diverges |
| Surface flow | counterclockwise, inward | clockwise, outward |
| Weather | cloud, precipitation, poorer | fair, settled |
Shapes on the chart:
- Ridge = an elongated high.
- Trough = an elongated low.
- Col = the neutral saddle between two highs and two lows.
Isobar spacing sets wind strength: close together = strong wind, far apart = light wind. The wind blows nearly along the isobars, not across them.
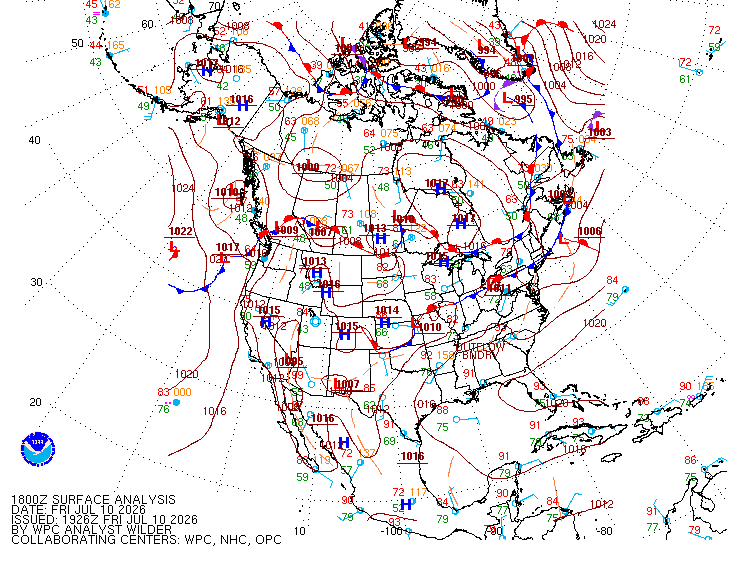
Buys Ballot's law: stand with your back to the wind and low pressure is on your left.
Prognostic (forecast) charts carry the same fronts and isobars projected forward in time:
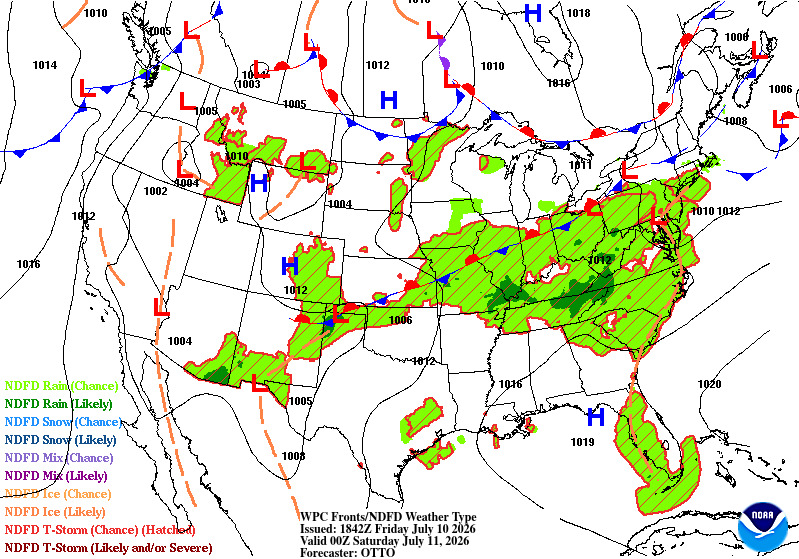
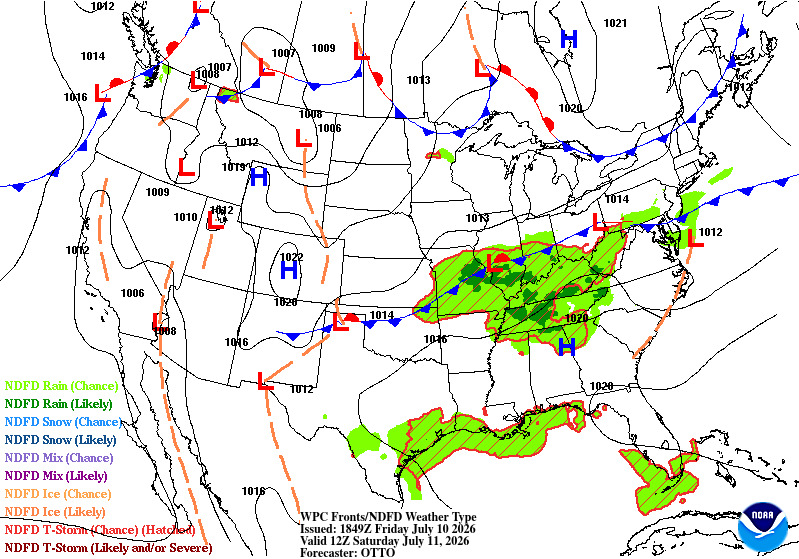
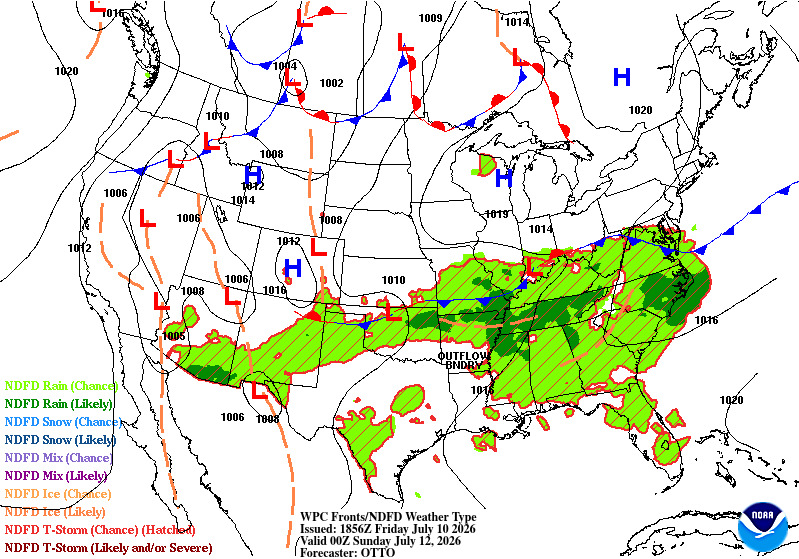
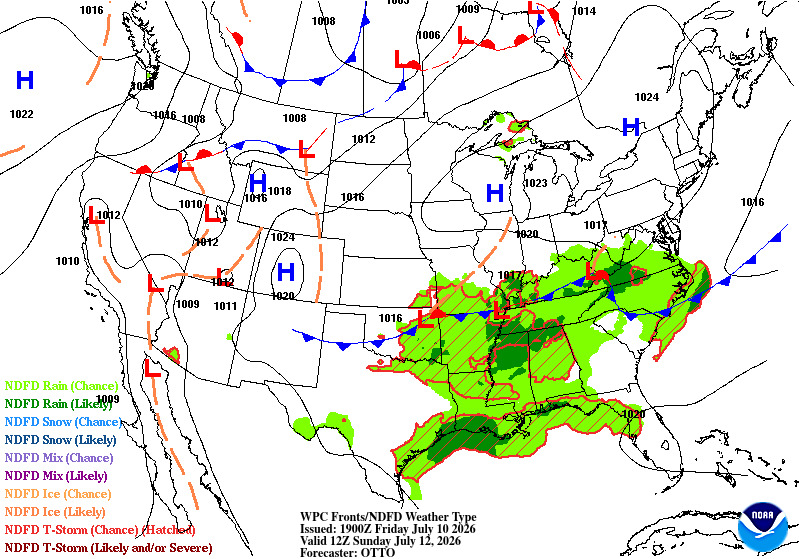
NOAA/WPC surface prognostic charts, public domain. The frontal and isobar reading skill transfers to Canadian charts; the Canadian GFA is a separate, differently formatted product (see its lesson).
Trap: the two rotations. Northern-Hemisphere lows spin counterclockwise, highs clockwise. Both reverse in the Southern Hemisphere.
Source note: the weather theory here is grounded in the FAA Aviation Weather Handbook (FAA-H-8083-28), a free public-domain text; the physics is universal and matches the Canadian material (equivalent to TP 9352). Canada-specific products/rules stay cited to the TC AIM.
References
- TC AIM MET 10.0
- TC AIM MET 11.1
- FAA Aviation Weather Handbook (FAA-H-8083-28)